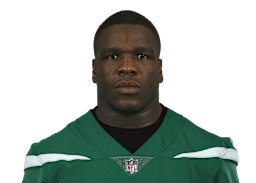
Doug Martin packed more value into his peak seasons than almost any running back in NFL history — a comet career that burned brightest when it mattered most. His KV-H peak of 79 is historically rare; while longevity was not his calling card, the impact of his best seasons is undeniable.

Reached 29% of the all-time Rushing Yards leader — a rotational/depth all-time profile at the position.
A 0–100 scale where 100 = matched the all-time leaderat this position. Built only from visible encyclopedia data — career production vs. the all-time leader, plus efficiency (EPA) and comparable-player confidence — so it's a transparent context score, not a subjective rating. Tiers: Elite ≥ 85 · Strong ≥ 65 · Solid ≥ 45 · Depth < 45. Comparable-player confidence: 90%.
Career Value · VORP
113 career value over replacement — #933 all-time of 4,649. 16.1/season above a replacement-level RB.
Career Profile
Pick #31 (Rd 1) · TB · 2012 · +19.2 vs expected KV-H
Fan Rating
Rate Doug Martin — All-Time
Explore More
Similar Players
StatVault aggregates multiple open-licensed and proprietary sources into a single profile. The depth indicator above shows which layers are available for this player.
Pre-1999 players have bio + draft data but counting stats are not available from any freely-licensed source. Players with ★ Career Only see verified career aggregates from nflverse draft_picks.
Production per snap — the box score normalized by opportunity. SIS is z-scored within running backs, shrinkage-regularized so small samples don't spike, over the NFL snap-count era (2012+).
Amber = this player (normalized to own peak). Indigo = average RBs aging curve. Group peak age: 21. Source: StatVault KV-H era (1999+).
Percentiles compare each raw measurement against position peers, the full combine pool, and the same draft class where enough samples exist.
Major career thresholds crossed, derived from regular-season totals (1999+).
Rushing
Receiving
Snap Counts (2012–present)
Proprietary StatVault Metrics
College stats are not imported for this profile yet.
StatVault has the verified college attribution (Boise State), but no parsed college box-score table is present in this profile artifact. The section stays here so every profile has a consistent college-stats landing point without fabricating unavailable rows.
Career teammates and draft class, derived from year-by-year rosters — every name is linked.
Statistical + physical similarity across every player in the database, position-relevant (0–100%).
Joined OAK (from TB)
Last recorded season with OAK
Drafted by TB — Round 1, Pick 31
From nflverse weekly injury reports · coverage begins 2009.
| Season | Team | Games Out | Designations |
|---|---|---|---|
| 2018 | OAK | 0 | W14Questionable· Knee |
| 2017 | TB | 1 | W13Out· Concussion |
| 2016 | TB | 5 | W3Out· HamstringW4Out· HamstringW5Doubtful· HamstringW7Out· HamstringW8Out· HamstringW9Out· HamstringW10Questionable· Hamstring |
| 2015 | TB | 0 | W4Questionable· Knee / Quadricep |
| 2014 | TB | 1 | W2Questionable· KneeW3Questionable· KneeW9Doubtful· AnkleW10Doubtful· AnkleW11Out· AnkleW12Questionable· Ankle |
| 2013 | TB | 2 | W8Out· ShoulderW9Out· Shoulder |
StatVault's proprietary player intelligence, informed by full career data. How Knox works →
Era-normalized career quality — z-scored against 7-season peers. See all →
Career durability — games played vs. scheduled, across 7 seasons.
Composite score across availability, IR frequency, and injury severity. See all →
Calibrated Hall-of-Fame probability — fit against actual enshrinement. See all →
What carries the case
Monitor score 51.2 · components sum to the score (All-Pro ×12 · Pro Bowl ×3 · League Lead ×4 · ranks/era/longevity weighted).
Career Fingerprint
Statistical profile across 5 dimensions
This player carries the statistical signature of a Hall-of-Fame candidate whose career was cut short by injury or circumstance. The gap between their ceiling and actual production is quantified below.
Rush Yds translated to the 2025NFL — each season's standing among its own-era peers, projected onto 2025's scoring environment. Modern-era (1999+) coverage.
| Season | Actual Rush Yds | Rush Yds/G | → 2025 Rush Yds | → 2025 /G |
|---|---|---|---|---|
| 2012 | 1,454 | 90.9 | 1,560+106 | 91.7 |
| 2013 | 456 | 76 | 1,368+912 | 80.5 |
| 2014 | 494 | 44.9 | 844+350 | 49.7 |
| 2015 | 1,402 | 87.6 | 1,639+237 | 96.4 |
| 2016 | 421 | 52.6 | 956+535 | 56.3 |
| 2017 | 406 | 36.9 | 644+238 | 37.9 |
| 2018 | 723 | 45.2 | 789+66 | 46.4 |
Data: nflverse:players, nflverse:player_stats, nflverse:snap_counts, nflverse:combine, nflverse:draft_picks, nflverse:injuries · multi-source verified via the StatVault Oracle · updated 7/31/2026
Frank Gore
RB
89% match
2012 Draft ClassmatesFull class →